

Degree Day Mapping
Degree day mapping helps visualize temperature patterns over time to better understand climate-driven processes. By mapping accumulated heat or cold across a region, degree day data supports applications such as agriculture, pest management, energy planning, and environmental monitoring.
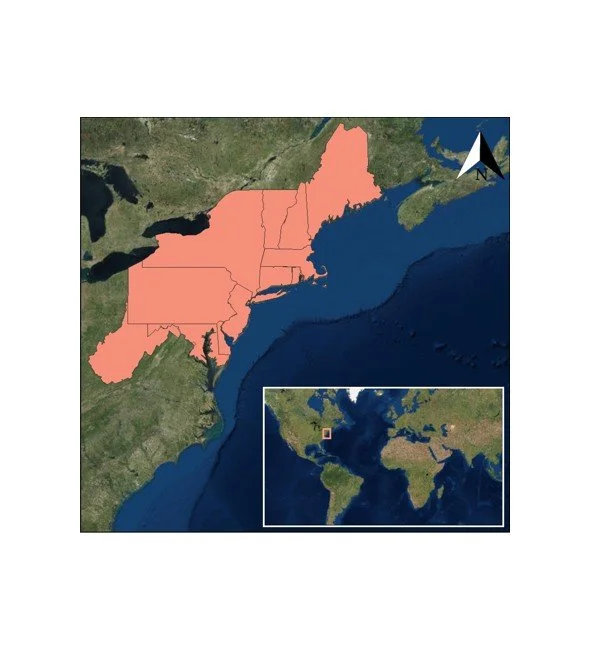
Study Area
This project consisted of two parts. The study area for both parts of the project focused on the Northeast United States as defined by the National Climate Assessment. The first study period was from 1975 – 2016 and the second study period was from 2002 - 2017.
Project Partners include: NOAA & its National Center of Environmental Information


Objectives
Provide a multitude of end users with an easily digestible perspective of how temperature trends have changed.
Utilize information from a variety of global temperature data and NASA satellite datasets.
Develop high spatial resolution temperature products specific to the Northeastern United States.
Compute heating, cooling, and growing degree days using daily LST data and in situ temperature data.
Create a product for partners that has the potential to expand to a diverse set of end-users to utilize the data.
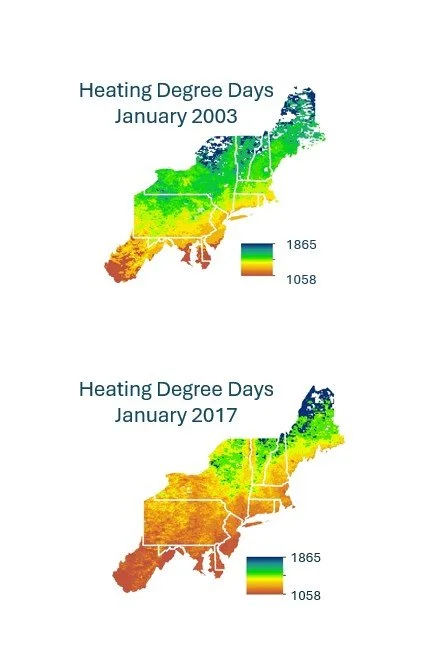
Results: Heating Degree Days
These maps were created of heating degree days of the Northeast Region for January 2003 and January 2017, highlighting the change in heating degree days in the Northeast in relation to the temperature trend throughout the study period. From these images, you can see that the methodology with LST satellite data provides high spatial resolution.
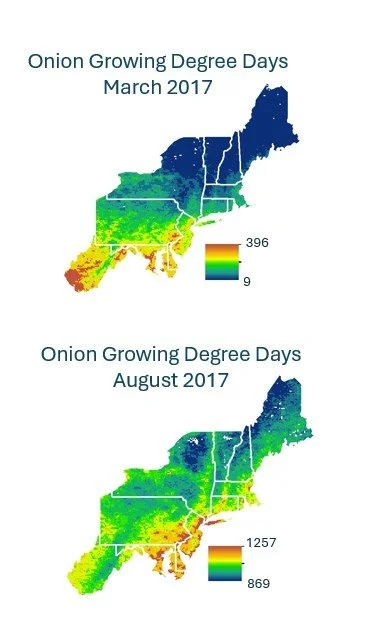
Results: Growing Degree Days
These maps were created of growing degree days of the Northeast Region for onions, specifically for March and August of 2017. With onions having a threshold base temperature of 35 degrees fahrenheit, you can see the difference of growing degree days between these two months, with March having fewer growing degree days than August. Once again, you can see from these images that the methodology with LST satellite data still provides high spatial resolution.
Results: Cooling Degree Days
This animation displays cooling degree days of the Northeast Region from August 2002 to August 2017. It shows the change in temperature trend with an increase in relation to the number of days that require cooling.

Conclusions
Northeast temperature trends as characterized by the running ranks and temperature scores exhibited a great degree of oscillation between two extreme readings rather than clustering near the median.
Land Surface Temperature data from MODIS is capable of providing higher spatial resolution temperature information than recently used in research practices.
End users used temperature scores for context and future state of the climate reports.
Degree days were operationalized within the agriculture and energy sectors.